Endpoint Graph View
HOW TO VISUALIZE WHAT WAS EXPOSED
Overview
The Endpoint Graph View provides a visual representation of exposed applications and identity data associated with an infected device. Use it to quickly understand where credentials were exposed and how they relate to the affected endpoint.
🔍 Access the graph
- Navigate to Endpoints
- Select an infected device
- Open the Graph tab
The graph is scoped to the selected device.
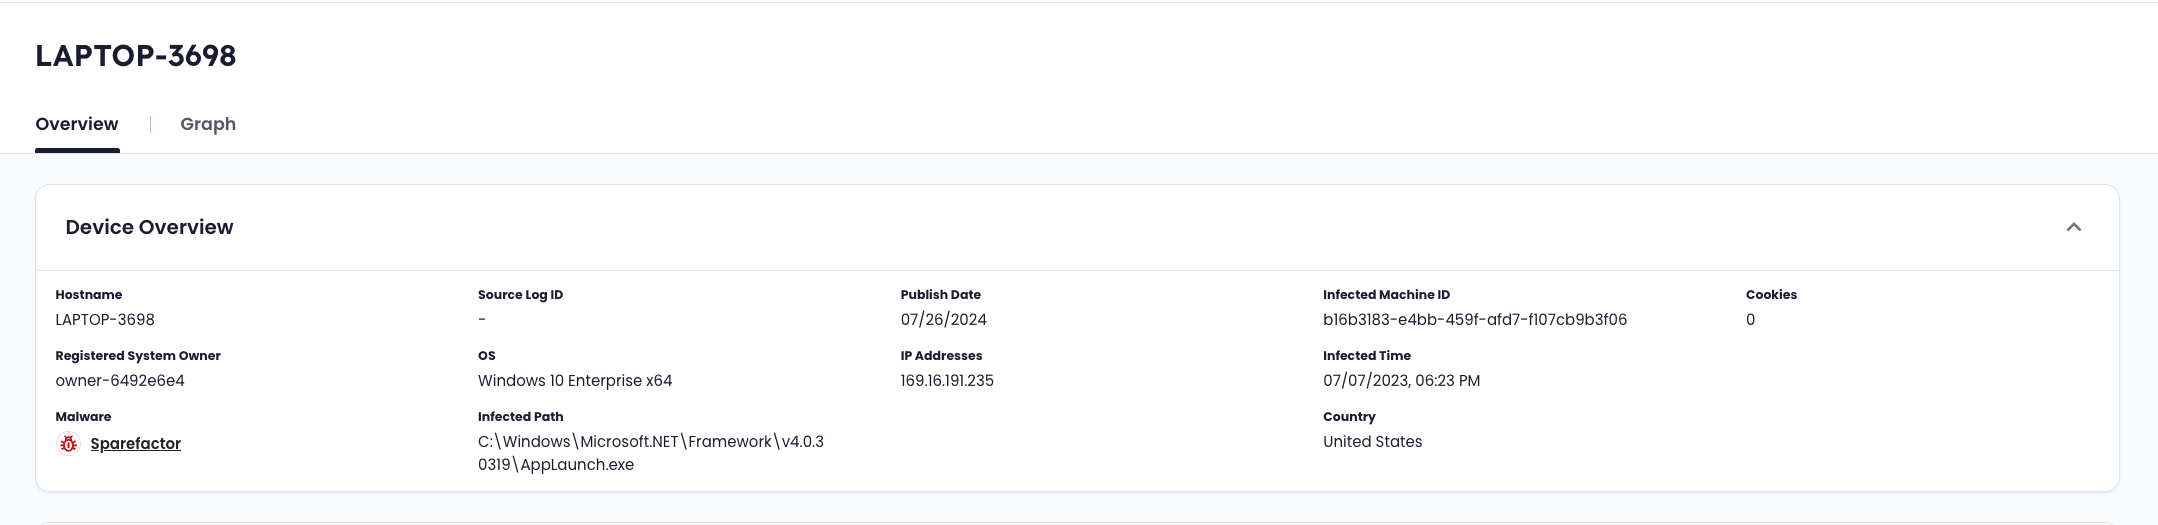
Access the Graph from the Device Overview within Endpoint Threat Protection.
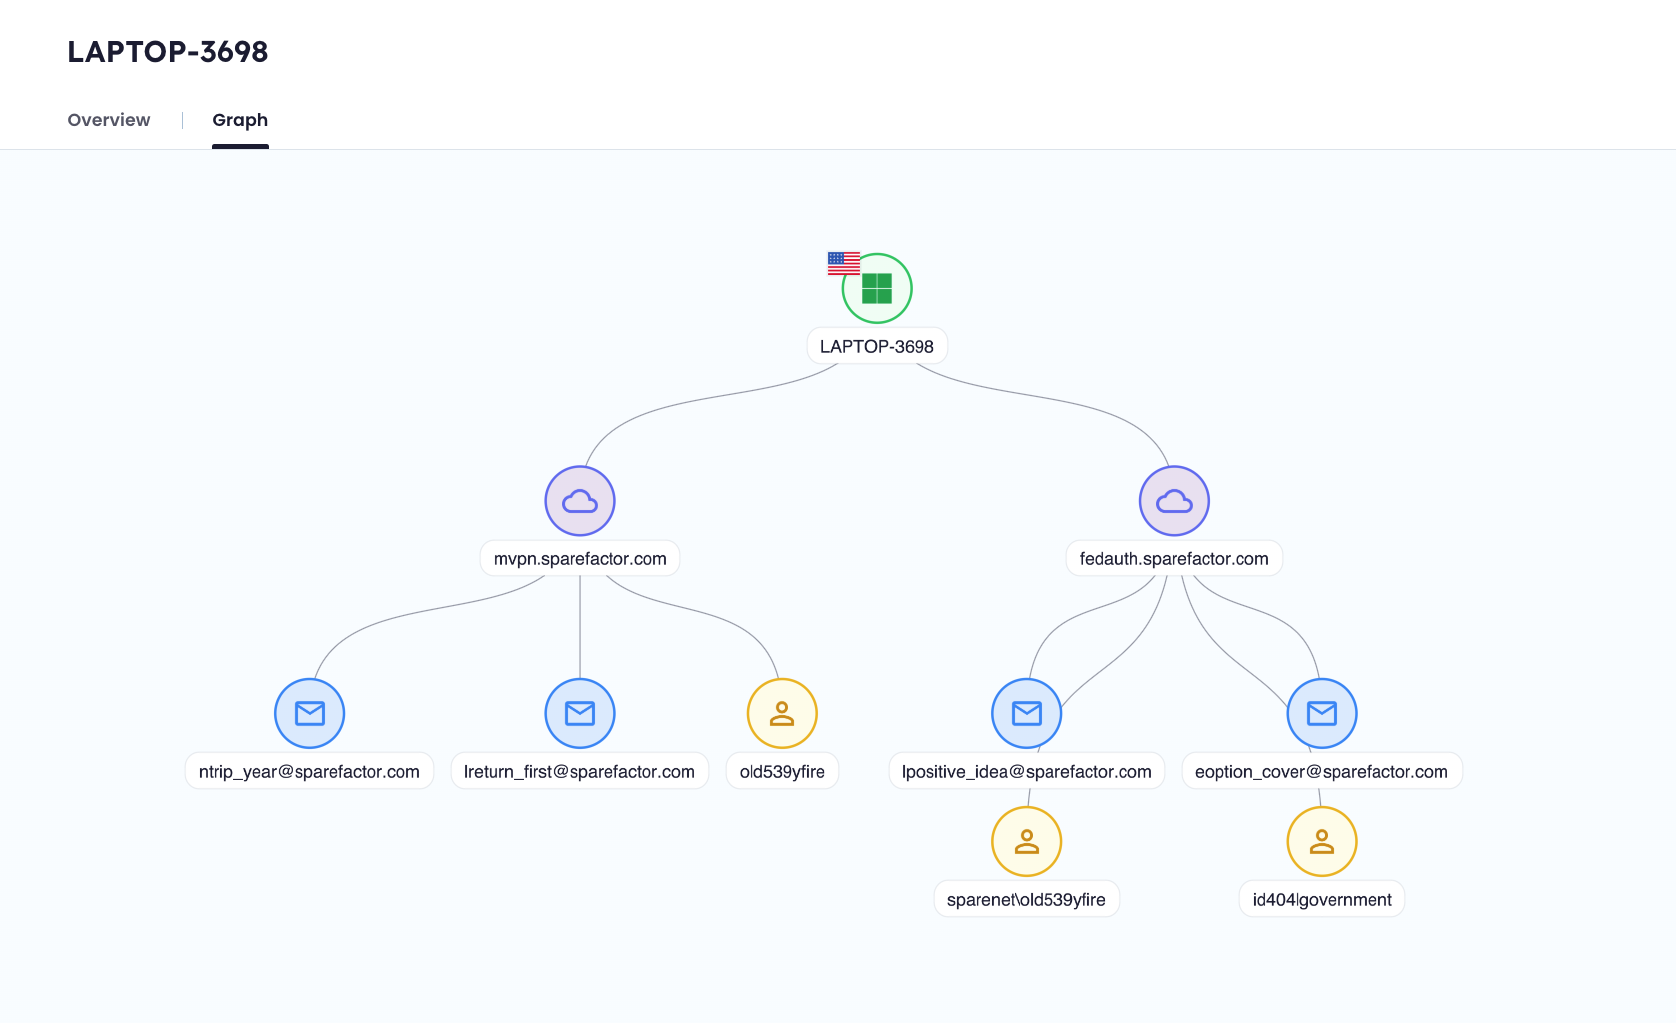
Quickly visualize everything exposed and the connections between the identity data.
🧭 Use the graph
The graph is interactive and designed for quick exploration.
| Action | Description |
|---|---|
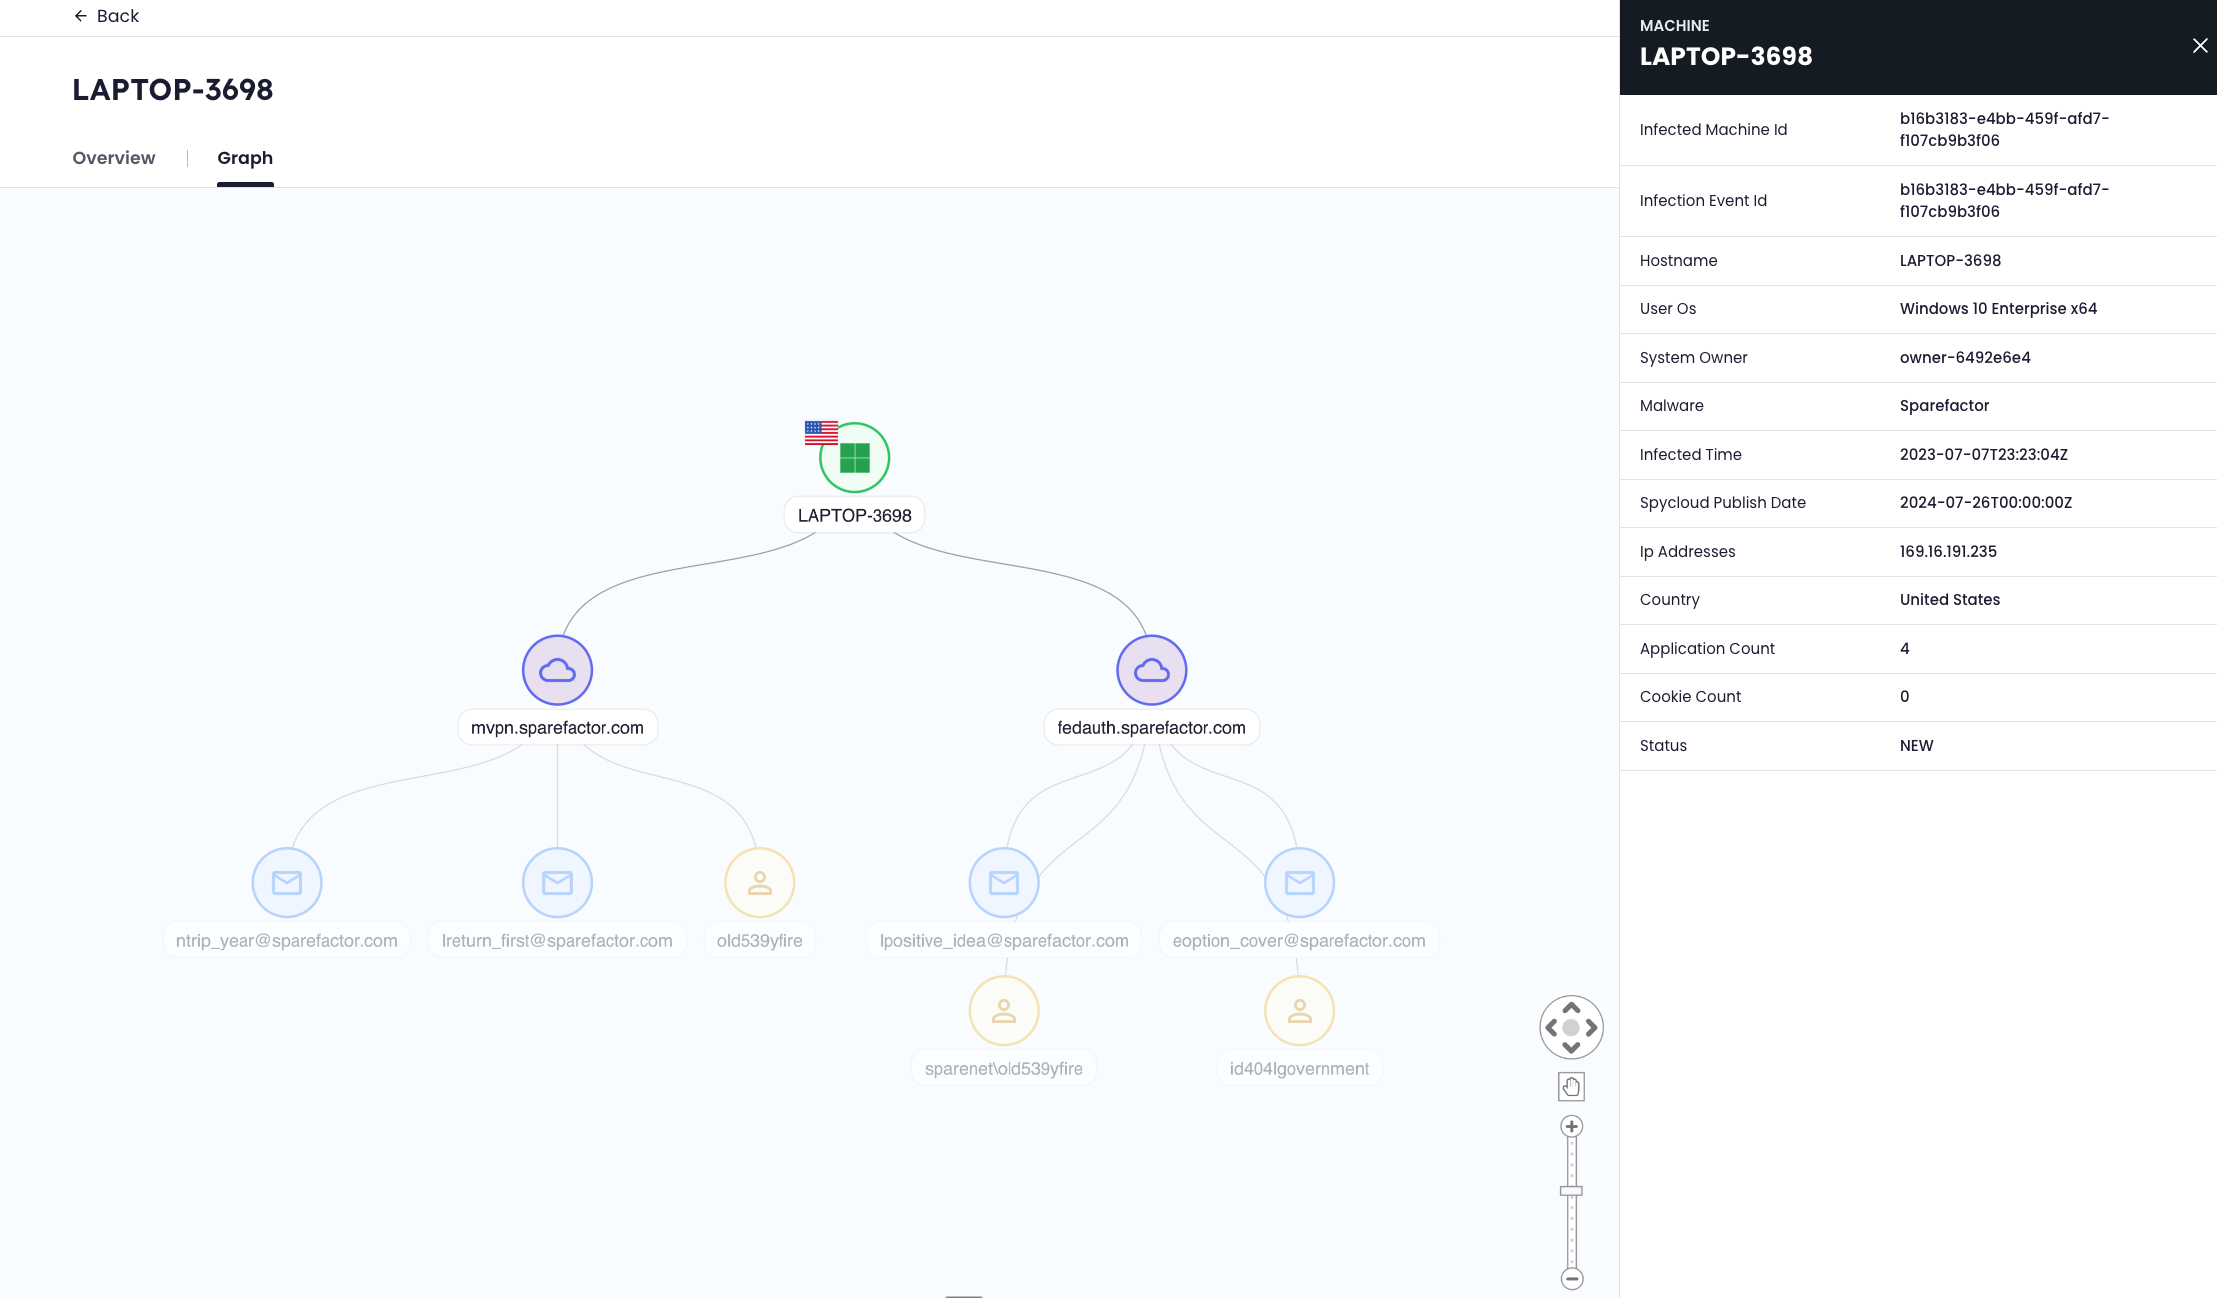
| Click a node | Opens a detail panel with more information |
| Drag | Move around the graph |
| Zoom controls (+ / -) | Zoom in and out |
| Navigation control | Reposition your view |
Each node opens a contextual side panel with relevant details.
Hover over each data point for additional details.
🧩 Understand the graph
The graph shows relationships between a single infected device, the applications where credentials were exposed, and the associated identities.
Node types
| Node | Description |
|---|---|
| 🟢 Machine | The infected endpoint (center of the graph) |
| 🌐 Applications (domains) | Services where credentials from the device were exposed |
| 📧 Email addresses | Credentials associated with exposed applications |
| 👤 Users | Identified users linked to credentials (when available) |
🔗 Relationships
- The device connects to applications where credentials were captured by malware
- Each application connects to associated email addresses
- Users are linked to credentials when identified
This is a single-device, one-hop view. It does not expand beyond the selected endpoint.
🔒 Data visibility
- Email addresses are partially masked if they are not associated with your monitored domains
- Masked data cannot be unmasked within the graph
⚡ What to look for
Use the graph to quickly assess:
- Which applications are affected
- How many credentials are exposed
- Whether credentials are reused across multiple applications
📌 Notes
- The graph represents a static snapshot of exposure tied to the selected device
- Large numbers of nodes may make the graph harder to navigate
For deeper analysis across identities, devices, and relationships, use SpyCloud Investigations.
Updated 3 months ago