Identity Threat Index
Track exposure changes over time to understand both active and historical threats
At-a-glance Identity Threat Index helps you instantly identify which vendors pose the greatest risk to your organization based on a composite of darknet data signals
Identity threat index decoded
These signals are weighted by volume, source credibility, recency, and severity – helping you prioritize threats with meaningful context. View current risk at a glance, or segment by exposure type and timeframe to track whether a third party’s security hygiene is improving or degrading over time
“How is this company protecting its employees and the company assets?”
- The index values reflect that company’s exposure, not their customers’.
- Example: if a monitored company is named in a public breach but no employee credentials were exposed, the Threat Index may not change.
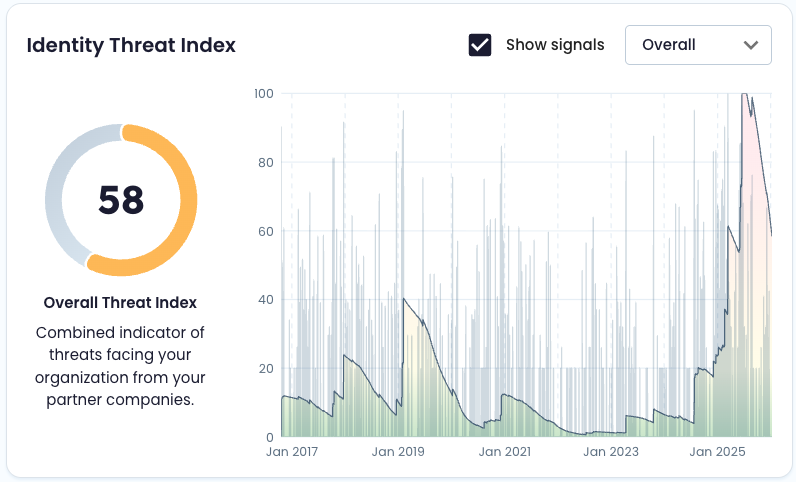
Identity Threat Index (overall)
0–100 score summarizing overall identity exposure for the latest completed date.
- Where shown, a trend indicator reflects a significant change vs. the previous day.
How exposure age affects Threat Index values
Threat Index values are designed to reflect meaningful, actionable exposure, not every historical event equally. While indices evaluate threat activity across the full history of a company’s domains, each exposure type has a practical effective lifespan. As exposure ages, its influence on the Threat Index decays over time.
This is based on a simplifying assumption:
the value of an exposed asset decreases with age.
For example:
- A laptop infected with malware today presents immediate risk
- That same device is likely to be re-imaged, replaced, or decommissioned over time
- As a result, very old malware exposures should not materially influence current threat interpretation
Because of this, older exposure activity contributes less weight than recent, credible exposure when calculating index values.
Beginning of time
For each company or domain, the “beginning of time” is defined as the first SpyCloud publish date that includes that domain. Exposure history and decay calculations are evaluated from this point forward.
This approach ensures Threat Index values emphasize current risk signals while still preserving historical context for trend analysis.
Using time windows to evaluate improvement
To understand whether a company is getting better, focus on frequency of events and compare recent windows:
Updated 6 months ago