Graphing
WITHIN SPYCLOUD INVESTIGATIONS MODULE
🧭 Overview
SpyCloud’s graph within investigations is a data visualization tool which allows investigators to explore the assets contained from their results in an intuitive, highly flexible node graph. Here they can parse through high volumes of data to discover and collect findings while visually telling the story for communication afterwards with their team.
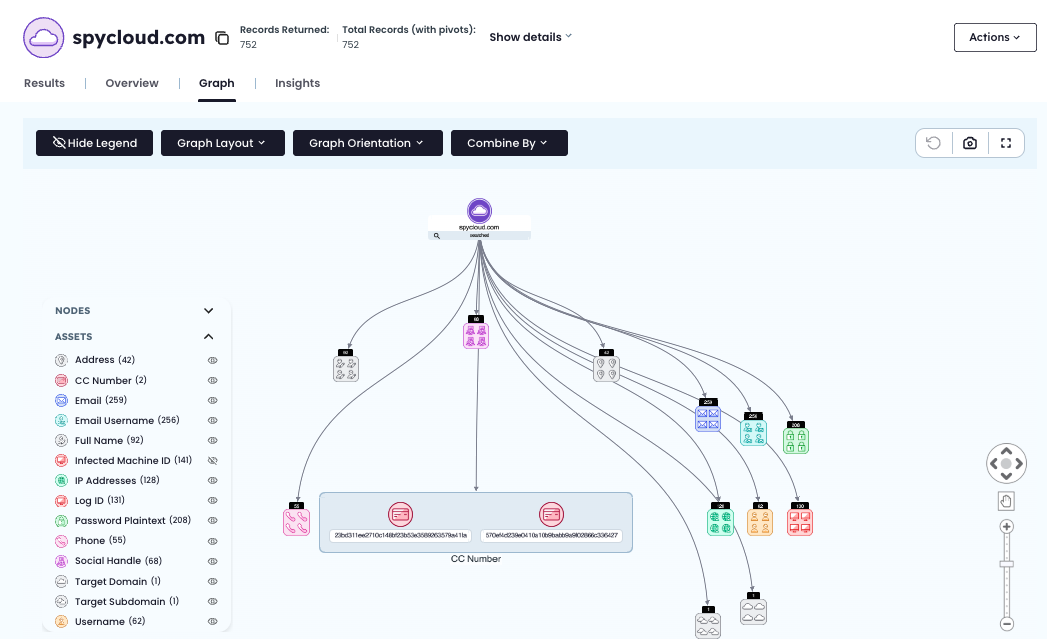
🪪 Interpreting the Header
In the header of the page you’ll see a breakdown of key search data including:
- Title of the asset you searched for
- Total records returned from search
- Total records including those acquired from pivots
- “Show details” will drop down the advanced details of your search
👇MENU HEADER

🧩 Nodes
By default, your results will be displayed in an organic (“wheel”) layout grouped by assets. Assets searched and pivoted on are presented in a rectangular tile that is larger and more visually distinct than standard nodes which live inside rounded squares alongside a volume counter.
- Searches & Pivots: Assets searched and pivoted on are presented in a rectangular tile that is larger and visually distinct.
- Asset Nodes: Collections of assets grouped by asset type. They live inside rounded squares alongside their total asset volume counter for the node (e.g., 30 = 30 assets contained)
- Assets Themselves: Individual data points with a circular icon and record volume counter (e.g., 2 = 2 records appeared in)
🖱️ Interacting with Elements
Each element offers a number of distinct interaction options:
Searches & Pivots
- No options for interaction.
Asset Nodes
- Double click to open and view all assets
- Right click an asset to connect it with an arrow to the search or pivot it came from
- Right click to present the following options:
- Add Pivot: Creates a distinctive pivot point and adds new records
- Remove Node: Removes the node from your view
- View Details: Opens the record details carousel which allows you to switch back and forth between record sets
Assets Themselves
- Double click to open record details
- Right click to present the following options:
- Add Pivot: Creates a distinctive pivot point and adds new records
- Add Fuzzy Pivot: Creates a distinctive fuzzy logic–based pivot point and adds new records
- Remove Node: Removes the node from your view
- View Details: Opens the record details carousel which allows you to switch back and forth between record sets
👇GRAPH INTERACTION
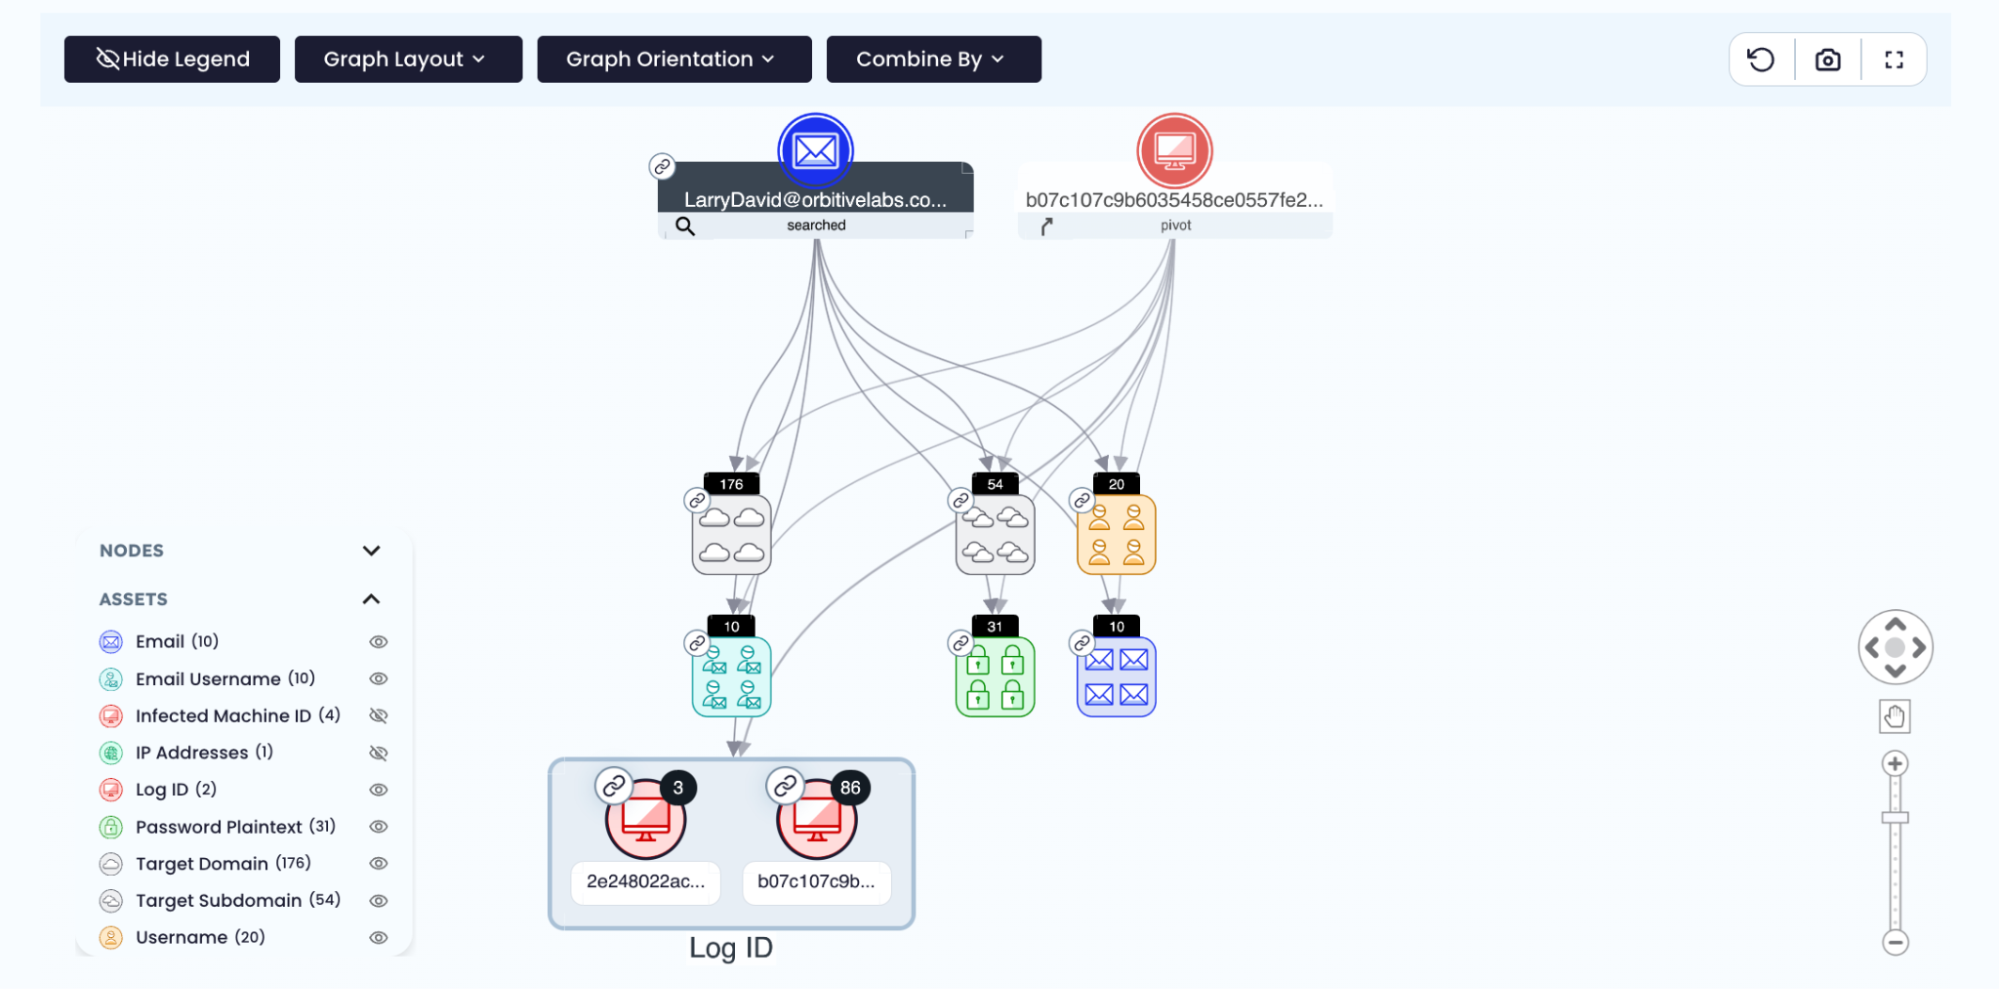
🕸️ Graph at a Glance
The graph has a number of features to help you see the narrative in the data and share it:
Header
-
View Options
- Hide Legend: Hides the displayed legend
- Graph Layout:
- Organic: Leverages 365 degrees of visual estate. Works best with massive assets/node volumes
- Sequential: Tells the chronological story of searches and pivots (best for multi-pivot investigations or findings sharing)
- Structural: Provides long distances and separations between node relationships (best for isolating relationships)
- Graph Orientation: Will place searches and pivots in any directional position required
- Combine By:
- Asset: Groups assets by their type (best for most investigative needs)
- None: Removes all groupings (best for drilling into relationships between distinct assets across types)
- Record: Groups by record
-
Actions
- Undo Pivot: Removes the most recent pivot from the search
- Screen Capture: Takes a snapshot of your graph results and exports as a PNG
- Full Screen Mode: Puts your investigation into full screen mode
🖥️ Body
-
Asset and Node Legend (left):
- Table: Shows the icon of the given item to aid in interpreting graph results
- Hide: Hide any asset or node type by clicking its eye icon
-
Control Pad and Zoom (right):
- Pad: Allows you to recenter or move your view incrementally up, down, left, or right
- Zoom: The further the dial is scrolled up on the scale, the greater the zoom into the results
👇GRAPH CONTROLS
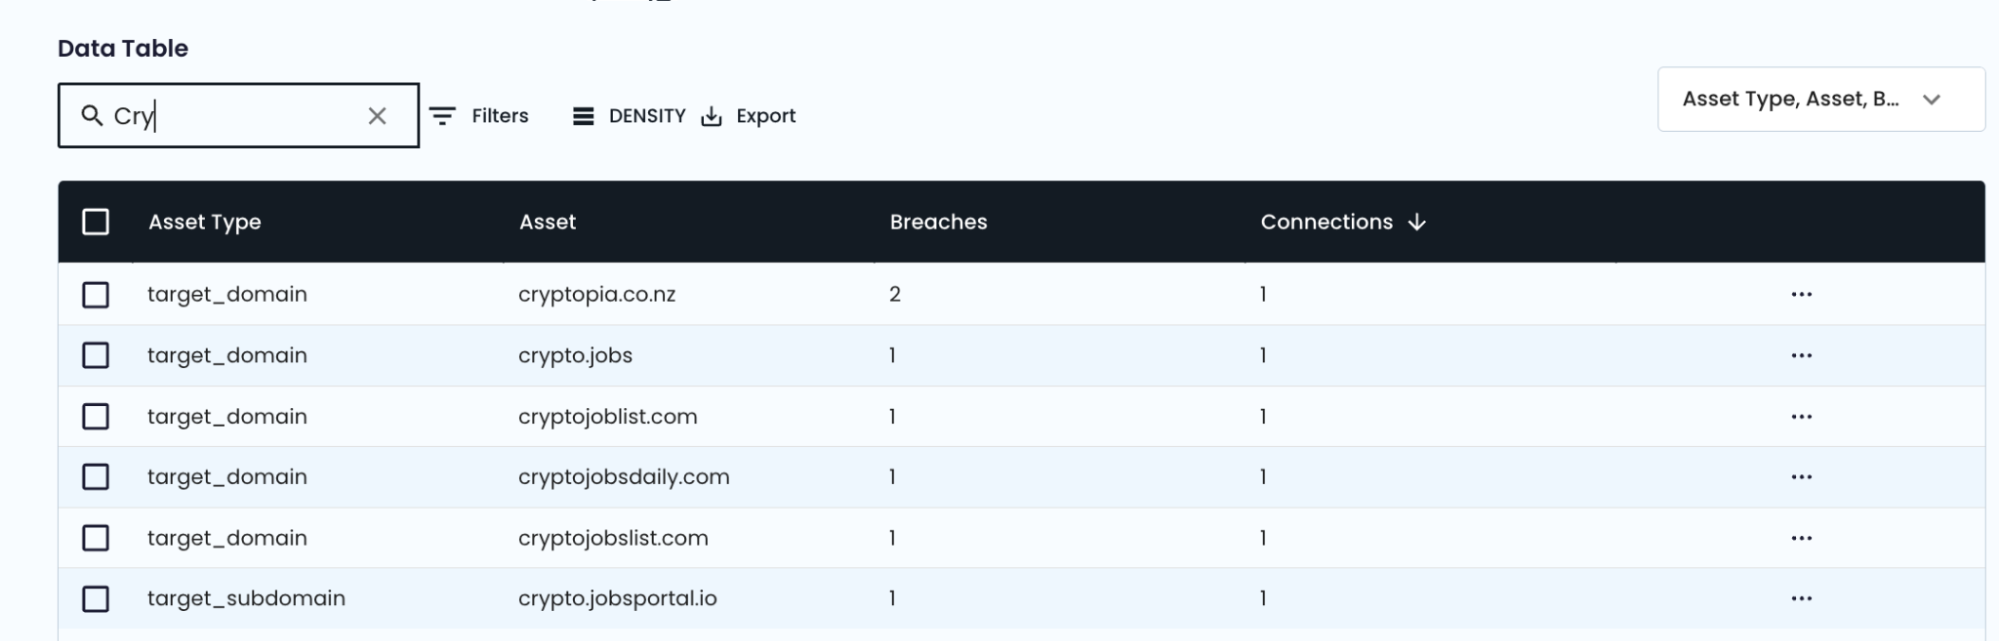
📑 Data Table
Allows you to search for specific data captured from searches and pivots in the graph to their details (best for when you have a specific asset of interest):
- Search: Search by any value in any column
- Filters: Multiple ways to pare down the results to precisely what is needed
- Export: Share filtered search results in CSV format
👇DATA TABLE